
TLDR: I “liberated” my Fitbit activity data and built a prototype for personalized step predictions with an eye on helping to keep me on target through the day. Check the money plot here.
I’m a huge fan of wearable tech, but a total cheapskate. Knowing that I’d been eyeing an activity tracker for a while, but that I wasn’t likely to get one on my own, my lovely wife gifted me with a Fitbit Flex for Christmas. I’ve loved having this little guy on my wrist, the phone app is slick, the web-page is full of cool looking dynamic plots, and checking the numbers to see them go up throughout the day is a total trip. One thing I found lacking though, was the daily reminder of my step count deficit. “Just 2000 steps left to go today!” is not super helpful at 11 PM. Wouldn’t it be cool if instead it kept a running prediction of your count, so you can see not just how many steps you’ve performed today, but if you’re actually on track to hitting your target?… “Well, hey… I can totally do that! Let’s make this happen!” I said to myself.
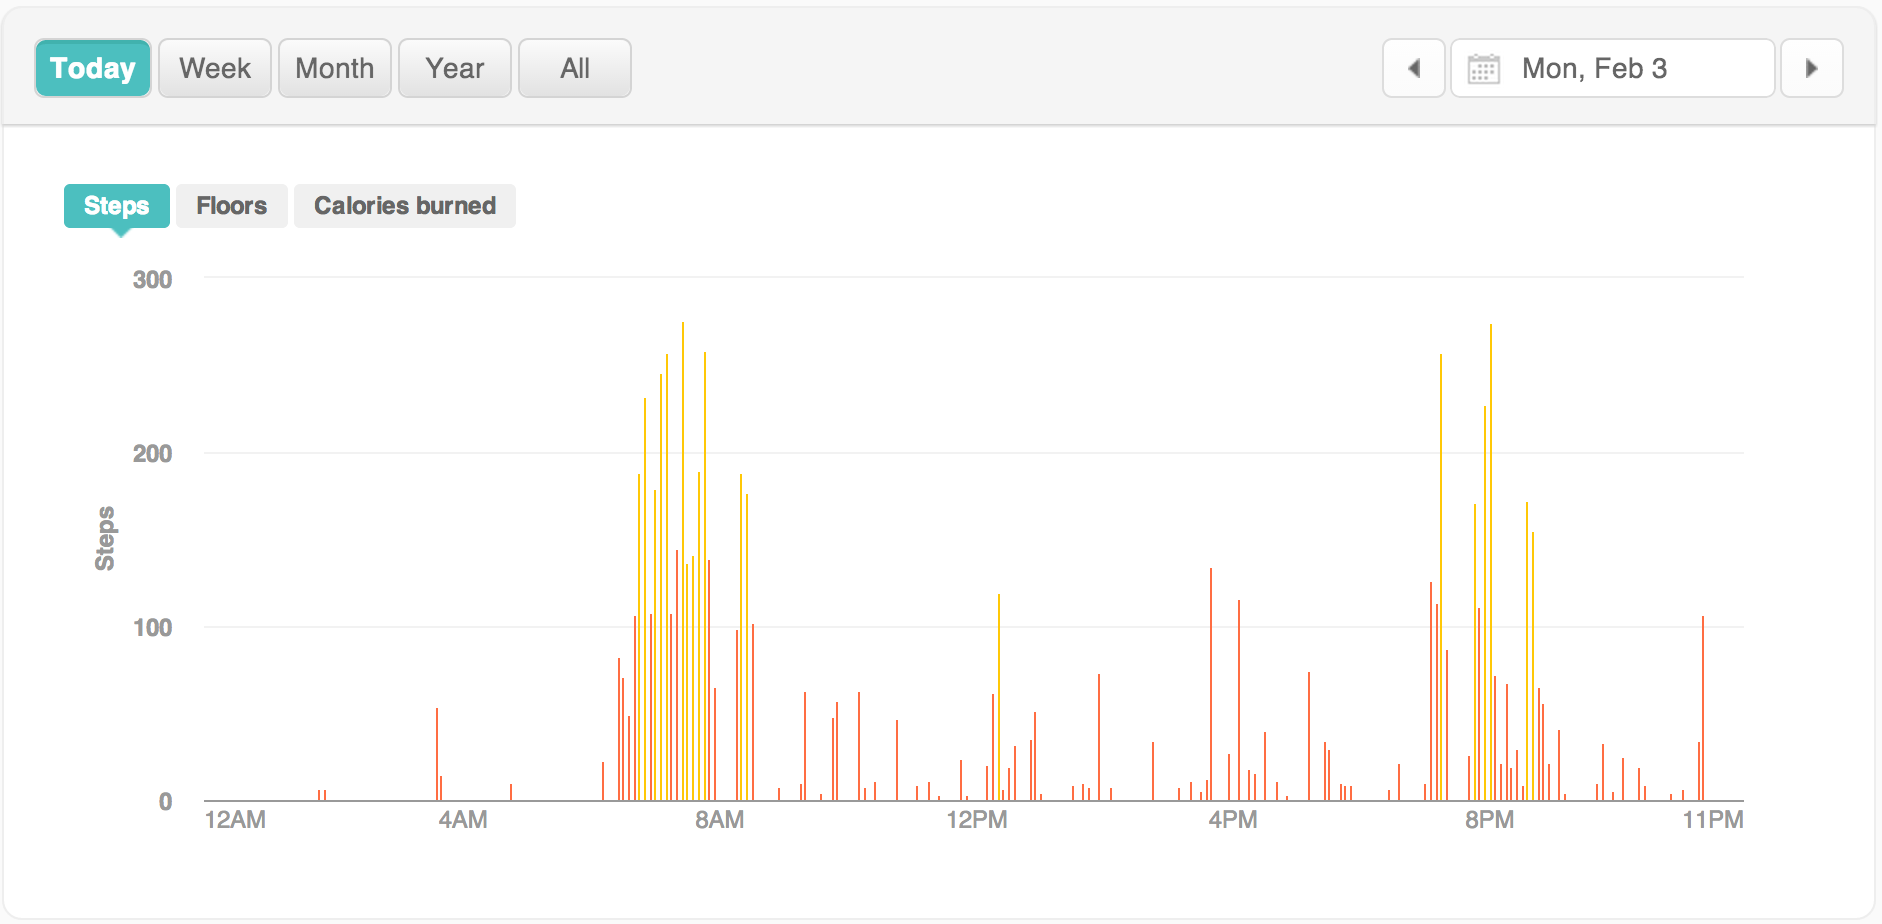
Cool plots Fitbit! But I want more! More!!!
Unfortunately, I quickly discovered that Fitbit’s data stewardship policy was a bit less open than I had expected. They have a really convenient (and well documented) API for pulling your activity from their servers, but limit you to daily totals. That’s nice and all, but come on, I want the most granular data I can get my grubby little hands on (well, short of accelerometer data). Daily totals just aren’t going to cut it. I fired off an email to api@fitbit.com about getting the next level of access, but haven’t yet heard back from them. But here’s the thing, the web panel plots with 5 minute granularity are all being rendered on my computer with HTML5. If that’s the case, I reasoned, well, the raw counts must be somewhere I can get to.
It’s not hard to guess what comes next. Long story short, python + urllib + BeautifulSoup + some web scraping = my data is liberated! I’ve got steps, activities, calories, and even the sleep data. (I might clean up the code and post it to github if anyone else is interested in using it). I’m still hoping I can finagle intraday access via the official API, but this’ll do for now.
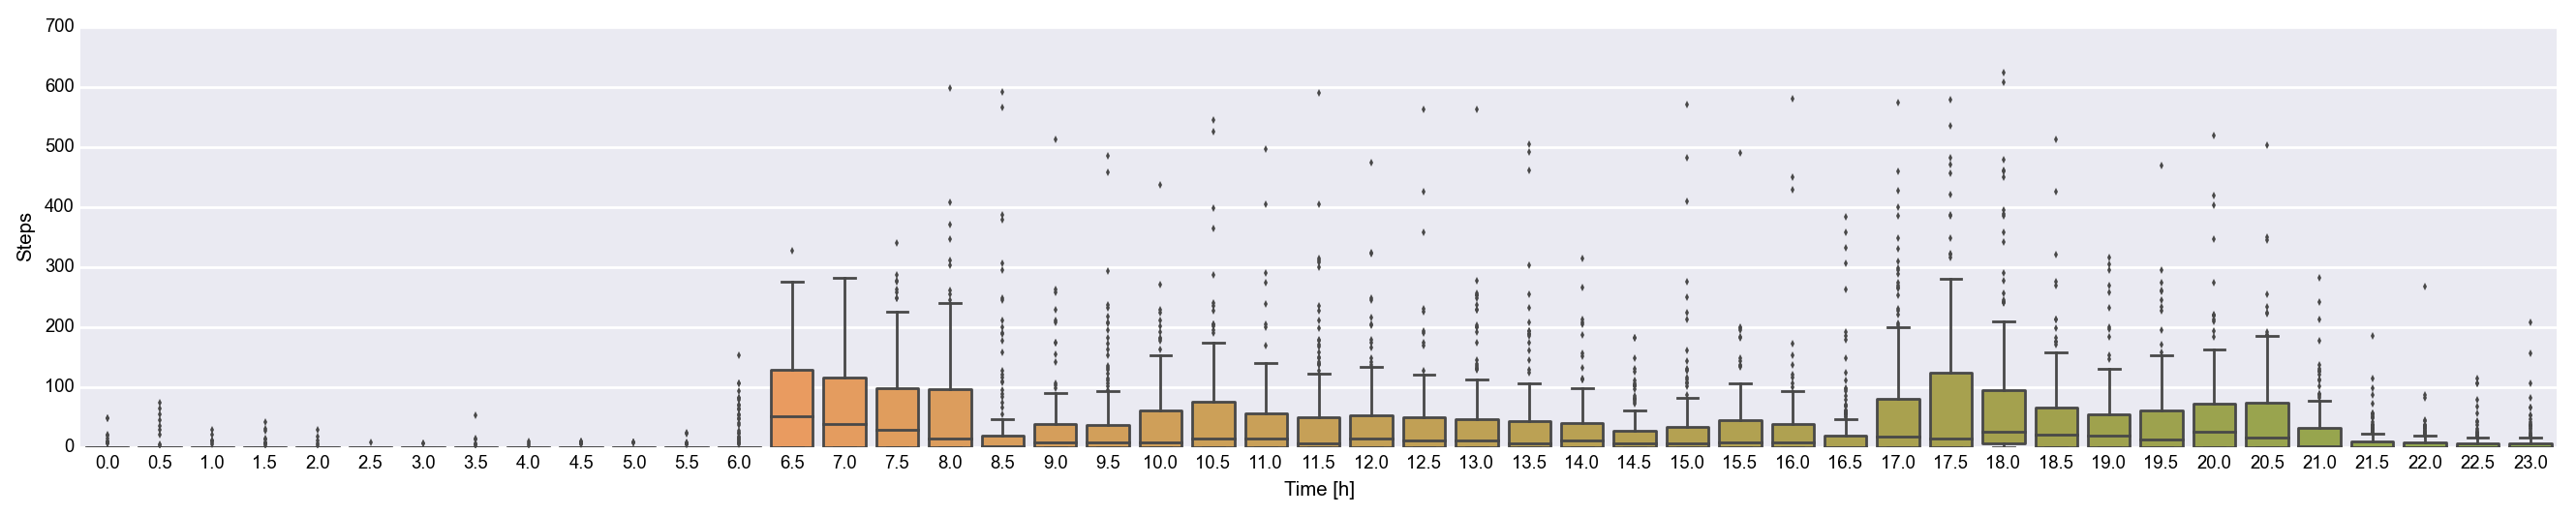
Daily step counts, binned by half hour.
The above boxplot shows my step counts in 15 minute intervals over the last month or so. It’s not a ton of data, but I’m such a creature of habit that some basic patterns are already visible.
I swear, I am not Truman Burbank.
I’m up at 6:30 every day, go through my morning routine, bike to the train, sit for a while, then bike the rest of the way to work where I promptly sit on my but for several hours. There’s some variation in the total activity, but the pattern is pretty clear. This kind of data should lend itself beautifully to a method which can learn the structure behind the stochastic process. As a proof of concept, I figured I’d try something simpler, like, a likelihood (which non-physicists may call an evidence based bayes method).
Here’s the goal:
- From 1AM to midnight, I want a running prediction of my daily total.
- If my expected daily total dips significantly below my target, I should get a warning (via email, SMS, whatever).
Here’s how I’m going to train the predictions:
- For each day, record the total steps taken for the day.
- For each hour of each day, record the running step total.
- Define an appropriate binning structure, and keep the running mean and rms in two matrices such that: $latex m^{\mathrm{avg}}_{\mathrm{hour}, \mathrm{steps}} = \overline{\mathrm{daily~total}}$ and $latex m^{\mathrm{rms}}_{\mathrm{hour}, \mathrm{steps}} = \sqrt{\overline{\mathrm{daily~total}^2}}$.
Here’s how I’m going to predict the counts:
- Check what time it is.
- Check how many steps I’ve taken so far.
- Find the appropriate bin and check what my average and rms has been on previous days with similar step counts.
- Call the mean my expectation value and calculate the variance.
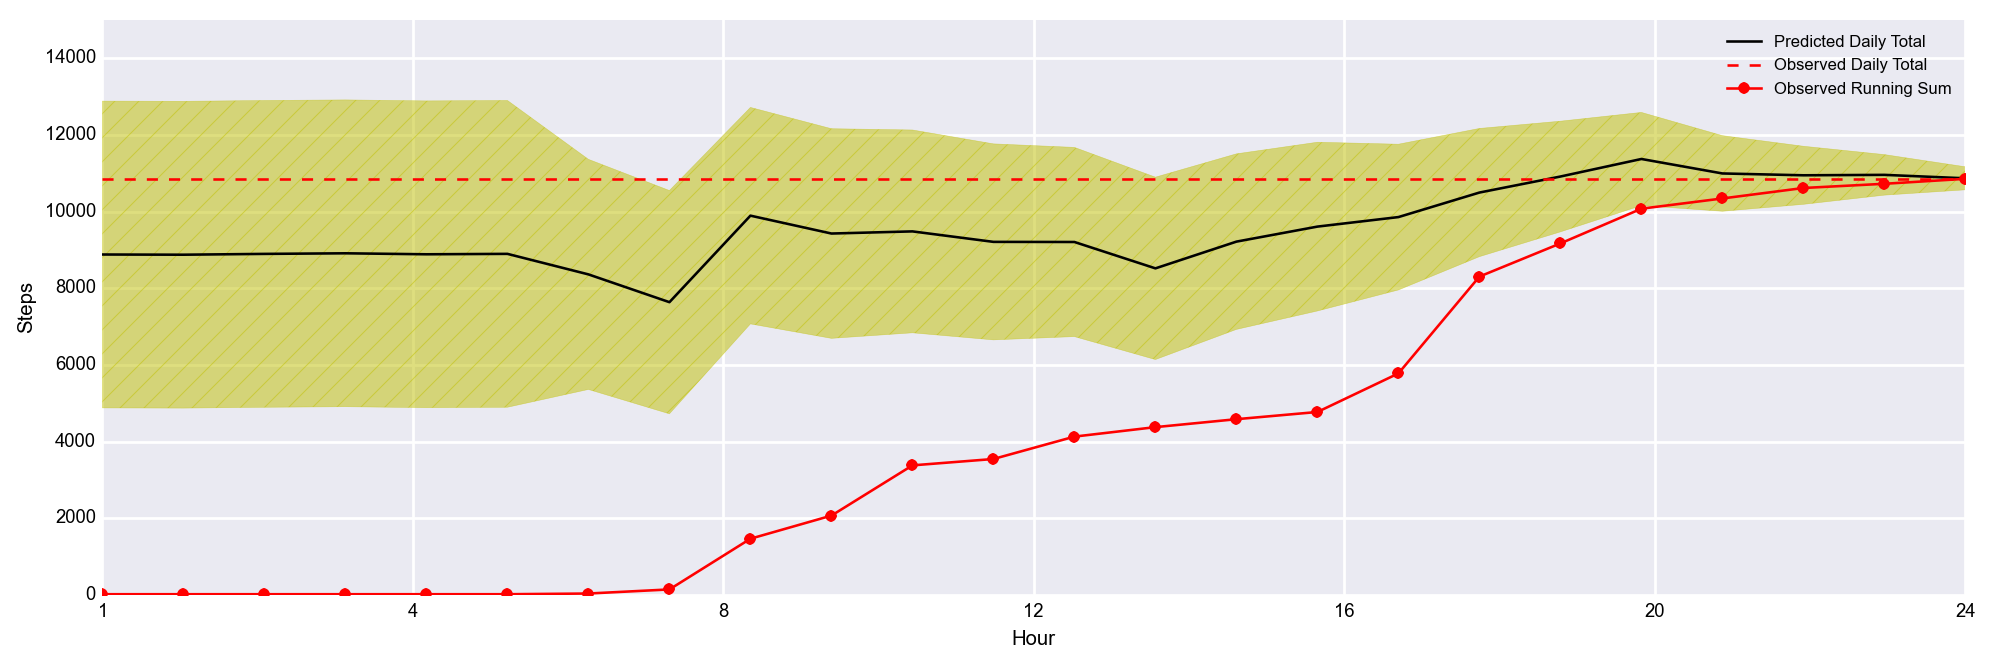
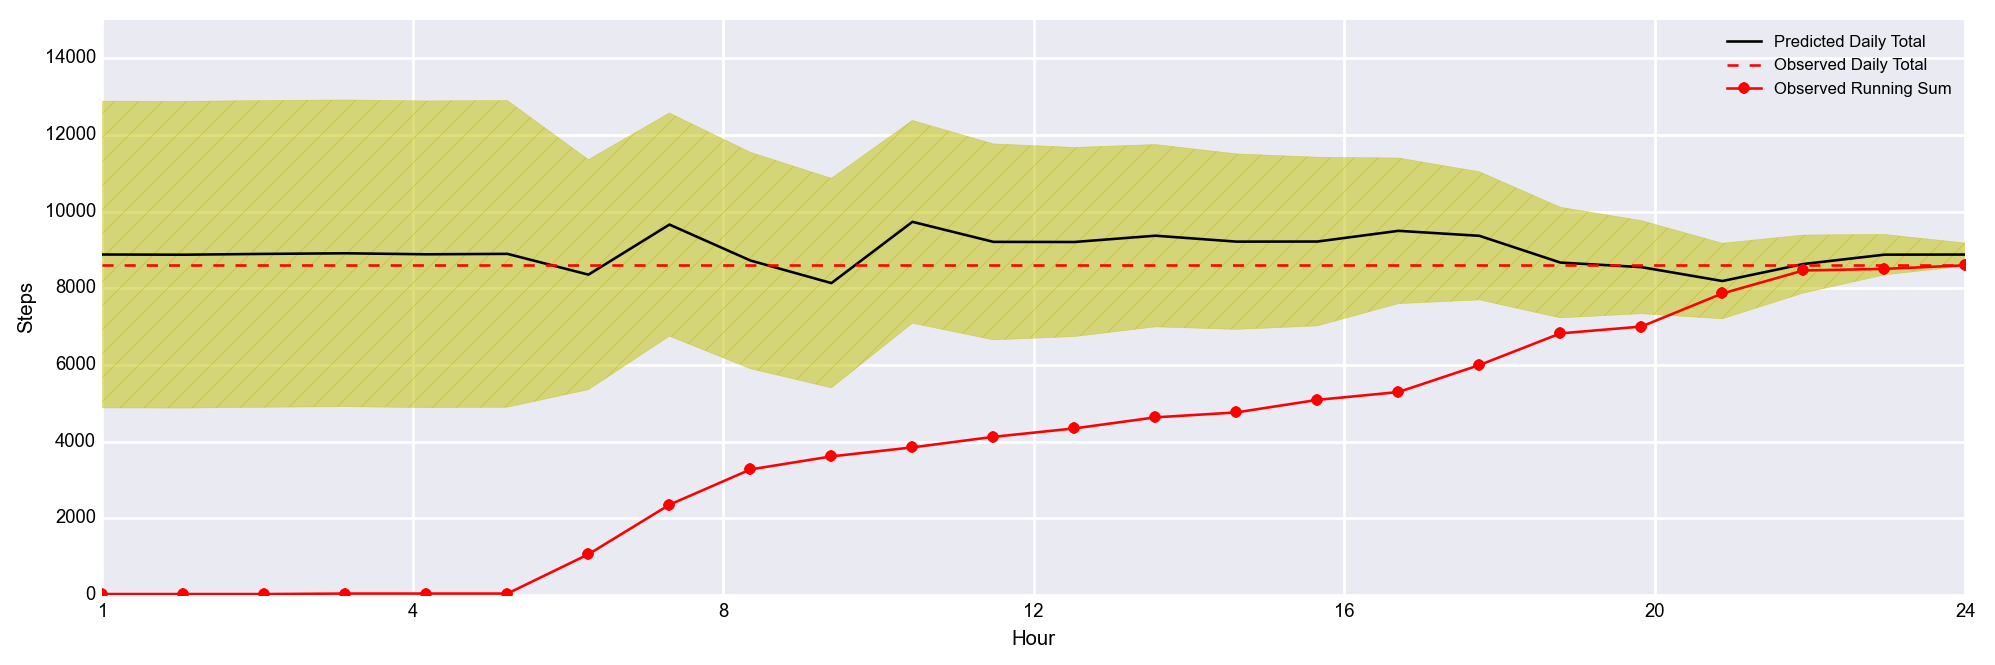 And it works!… Well, sort of… The black line is the predicted step count. The yellow band gives you a sense of the uncertainty (this is not rigorously formulated at the moment), the red dashed line is the observed total count for the day (just to guide the eye), and the solid red line shows my steps accumulating throughout the day.
What you see here is that the black line is pretty stable, and pretty accurate, but that the uncertainty band is huge! Unfortunately, I just don’t have a ton of data here, so the sampling error is quite large. That’s going to make it difficult to say with any statistical certainty that I am at risk of undershooting my goals. That yellow envelope should shrink as I add more and more days to the training data, so all hope is not lost.
What’s cool, is that there are days where I break with the median behavior, and the predictions update accordingly throughout the day.
This toy example convinces me that making accurate predictions is totally feasible. I suspect that I’ll want to avoid canonical time-series analysis techniques here. Since I’ve already determined that I’m a creatures of habit, what I really want is a machine learning algorithm that is susceptible to over-fitting, and to let it over-fit like crazy! I’ve seen some really interesting work done with recurrent neural networks to generate new text corpus character by character, and one of the research guys here at AT&T wrote his thesis on using graphical probability models to infer chord progressions and generate realistic music. I’m thinking either of these would be a fun technique to apply to this problem.
More results to come in a future post! Shoot me a line if you’ve got any input. 😉