If You Love Your Data, Let It Go

TLDR: I “liberated” my Fitbit activity data and built a prototype for personalized step predictions with an eye on helping to keep me on target through the day. Check the money plot here.

I’m a huge fan of wearable tech, but a total cheapskate. Knowing that I’d been eyeing an activity tracker for a while, but that I wasn’t likely to get one on my own, my lovely wife gifted me with a Fitbit Flex for Christmas. I’ve loved having this little guy on my wrist, the phone app is slick, the web-page is full of cool looking dynamic plots, and checking the numbers to see them go up throughout the day is a total trip. One thing I found lacking though, was the daily reminder of my step count deficit. “Just 2000 steps left to go today!” is not super helpful at 11 PM. Wouldn’t it be cool if instead it kept a running prediction of your count, so you can see not just how many steps you’ve performed today, but if you’re actually on track to hitting your target?… “Well, hey… I can totally do that! Let’s make this happen!” I said to myself.
Continue reading

Faster Serialization in Python

TLDR; Pickle is slow, cPickle is faster, JSON is surprisingly fast, Marshal is fastest, but when using PyPy all fall before a humble text file parser.


I’ve been working on the Yandex Personalized Web Search challenge on kaggle, which requires me to read in a large amount of data stored as multi-line, tab-separated, records. The data is ragged, each record has sub-fields of variable length, and there are 34.5 million of them. There are too many records to load in memory, and starting out, I’m not quite sure what features will end up being important. To reduce the bottle-neck of reading the files from disk, I wanted to pre-process the data, and store it in some format which afforded me faster reading and writing off the disk, without going to a full blown database solution. I ended up testing the following formats:

  1. pickle (using both the pickle and cPickle modules), a module which can serialize just about any datas structure, but is only available for python. I’ve used this extensively to persistify derived data for work.
  2. JSON, which only supports a basic set of data-types (fine for this use case), but can be handled by a larger number of languages (irrelevant for this use case).
  3. Marshal, which is not really meant for general serialization, but I was curious about it’s internals. This is not really a recommended format, the documentation clearly warns “Details of the format are undocumented on purpose; it may change between Python versions.”

Continue reading

A (brief?) shining moment

 TL;DR: We’re kicking butts over at kaggle.com!


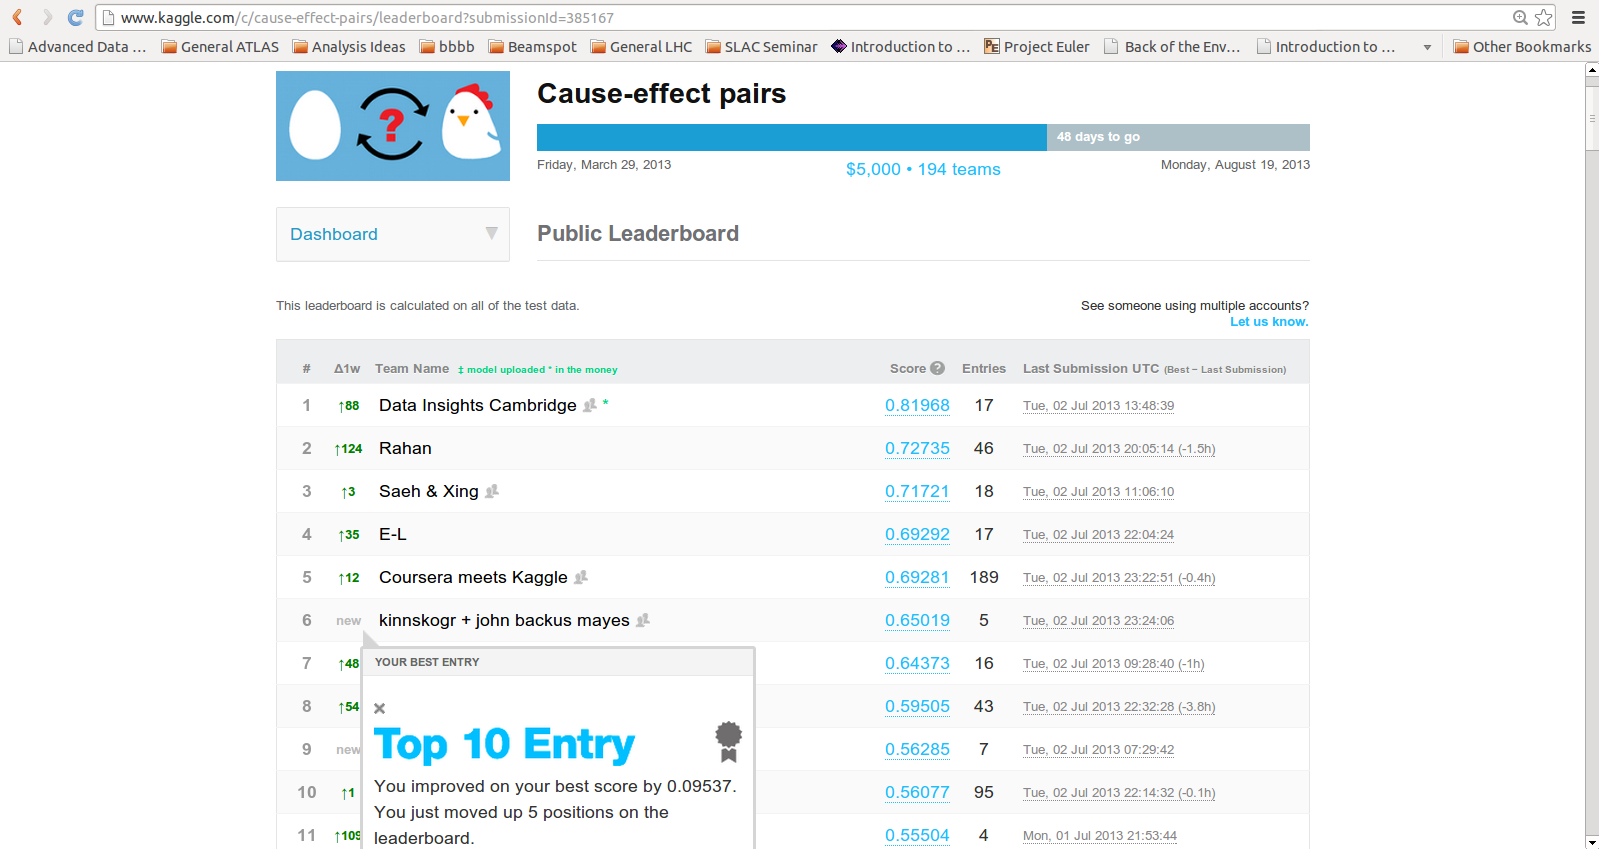
A colleague and I recently joined a kaggle.com competition in which, given a set of measurements of two variables, the point is to determine whether one is causally linked to the other. Conceptually, this is an interesting problem, and we’ve only just started hacking away at it, but we’ve already had some success. Our latest submission netted us 6th place!

top10
I feel all warm and fuzzy inside. Now, time to step up our game and move up higher!


Samsung Motion Analysis

TLDR; A write up of an assignment from Coursera’s Data Analysis course aiming to identify patterns of activity from accelerometer data using SVD and Randrom Forests in R.

I’ve been following Coursera’s “Data Analysis” course, taught by Jeff Leek (straight outta Hopkins!). It’s been interesting, having spent 7 years doing particle physics, most of the techniques are not new, but the jargon is. It has also highlighted some important differences in the methodology of Particle Physics and Bio-statistics, driven by our reliance on synthetic data (or conversely, driven by their lack of reliable Monte Carlo). Since the second assignment is over and done with, I thought I’d post a little write-up here.

The aim was to study the predictive power of data collected by the accelerometer and gyroscope of Samsung Galaxy S II smartphones, carried by a group of individuals performing various activities (walking, walking upstairs, walking downstairs, sitting, standing, and laying down). The dataset consists of 7352 samples (pre-processed by applying noise filters and by sampling the values in fixed time windows) of 562 features collected from 21 individuals. Of these 21 individuals, I randomly set aside three as a testing sample, and another four as a validation sample.

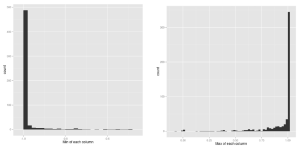
max_min_vals
Continue reading