
TL;DR: There were some rookie mistakes lurking in some python code which I hunted down with profiling (using cProfile), reducing execution time by an order of magnitude.
This post is a little story about some profiling I did on python code which ultimately revealed that a poor choice of datastructures had a significant impact on code performance. The problem was in some python code which I use to look at trends in physics topics posted to arxiv.org (more on the output of the tool in another post). After pulling the data from arxiv, the script works out word frequency and identifies increased occurences. The parsing of the corpus was taking an excessively long time, my laptop fan would start whirling, and the system would slow to a crawl. Clearly, something very non-optimal was happening.
My first thought was that the issue was in a part of the code that handles the histograming of the occurences, but nothing obvious jumped out at me when I reviewed the code. Enter the python profilers. These things are gret, they’re dead simple to run, and the results are relatively easy to parse. Of the three profilers the python documentation recommends, cProfile is my favorite.
Want to check how a function is performing:
import cProfile cProfile.run(‘myFunc()’, resultsFile’)
Want to check how the whole progam is working:
python -m cProfile -o resultsFile myScript.py
The output pointed me in a direction I had not expected: the operation that removes common english words (‘is’, ‘the’, etc…) from the corpus. The blacklisted words were stored in a list, against which each word is checked to see if it should be discarded. A list! In case you’re not as ashamed of me as I am, let me impress upon you that this is a really dumb decision (at least I sorted the list). The reason this is such a poor choice is that sets, unlike lists, hash their values. http://wiki.python.org/moin/TimeComplexity gives a nice summary of the Big O running time of various operations on python datastructures. A search on a hash is performed in O(1) time (on average). A search on a list goes like O(n). Given the size of the blacklist and how often the code must call the function, this becomes a serious drag on performance.
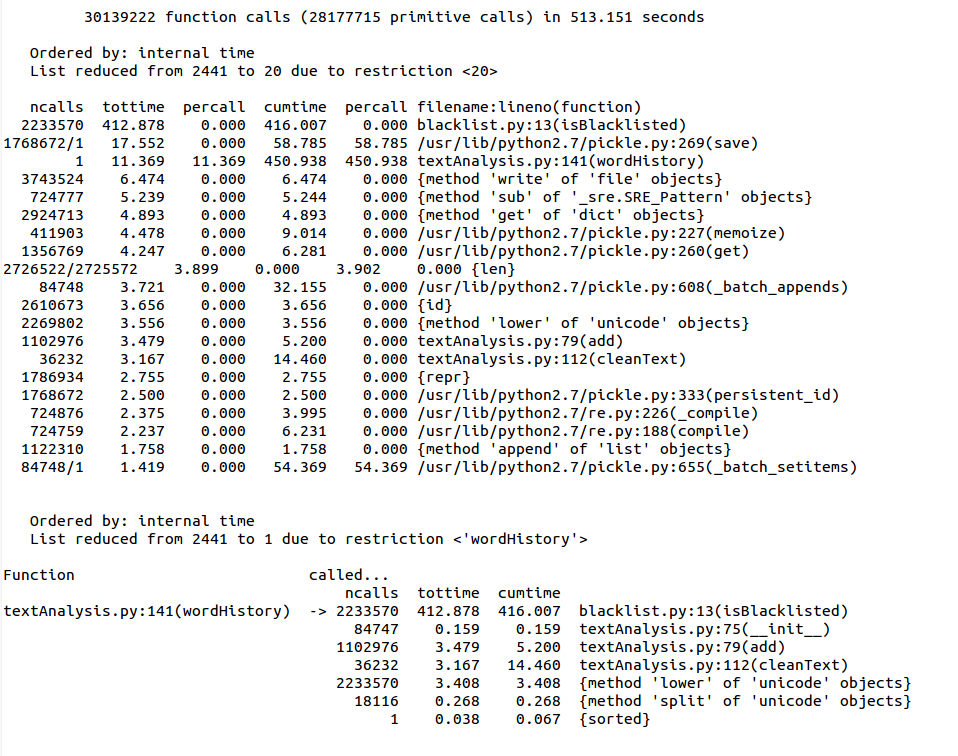 Here you see that we spend 450 seconds in “wordHistory”, of which 92% is in the 2233570 calls to the function that checks word membership in the blacklist.
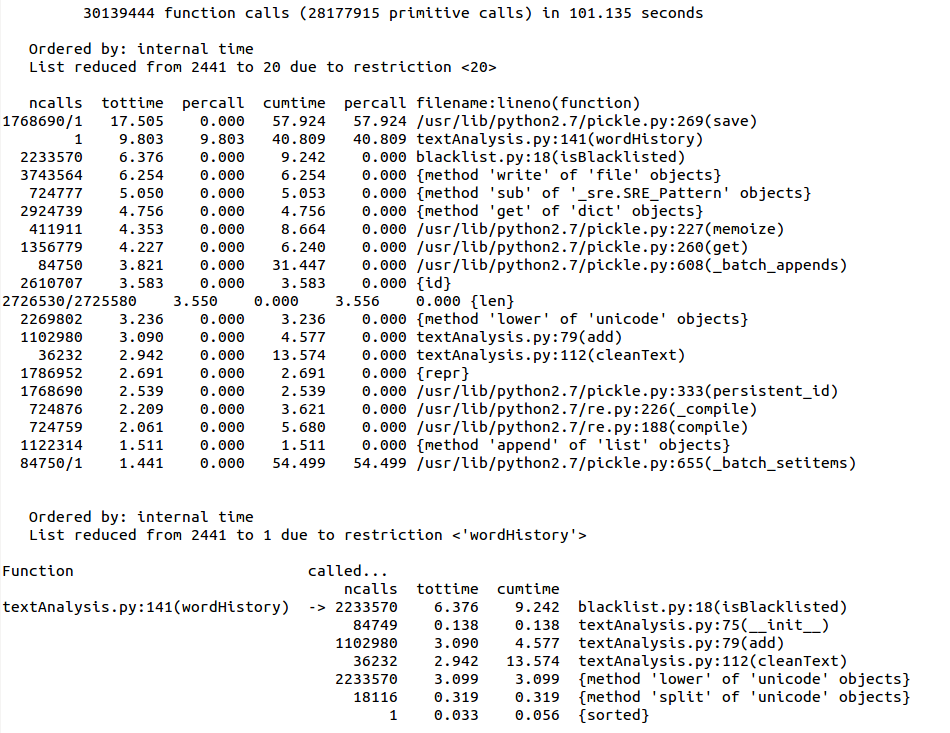 Using a set gives a factor of 4 improvement in speed. That’s already nice, but if we have 2233570 words in 18116 articles covering four years of articles, the performance will degrade again when more data is added. Three immediate solutions come to mind:
- Since there is some overhead in function look-up, moving the call outside of the loop by using a filter. However, this would introduce another operation on the list before the loop, which is not very desirable. ((confirmed, just tried this and it is about 10% slower than the current approach))
- The blacklist could be moved to the step where the data is pulled from the arxiv. It would then sit in the shadow of the much slower network I/O operation. This sweeps the problem under the rug, and the data is lost before storage.
- Multi-threading! The for loop which checks for word membership could be substantially sped up by splitting the loop into multiple threads or processes. Not a project for today, but something to keep in mind.
You’ll have noticed that the other time hog is the “cleanText” function. This grooms the text to simplify the word frequency analysis: making everything lower case, making all words singular, removing html tags, and combining certain-words like “cross” and “section”. Now that the blacklist has been optimized, this step actually takes the longest.
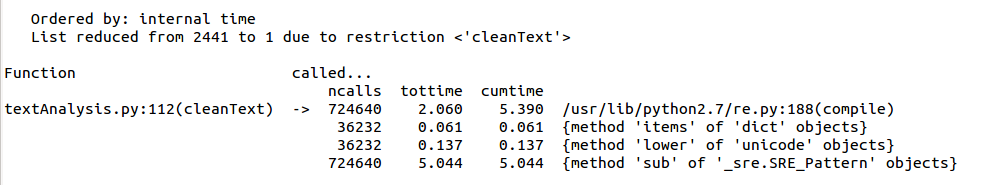
More silliness was afoot. The text grooming uses regular expressions. Like a good little boy, I was compiling my regular expressions to speed them up. Like a dumb little boy, I was compiling each one of them once per function call (i.e. once per article). Now, the code stores the compiled regular expressions in a global list. They get generated once (when the datastructure is empty) and then re-used for every function call. This is another silly mistake that grows linearly with the size of the corpus, and fixing it makes a big difference.
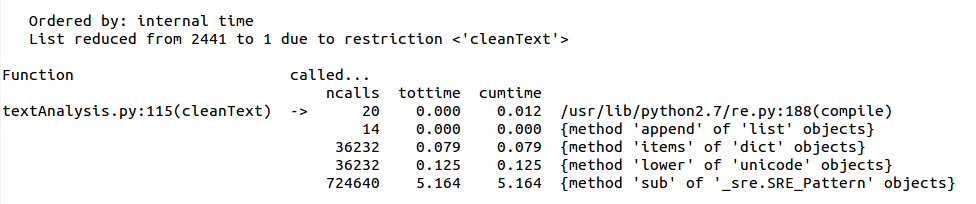
With that done, 61% of the time is spent writing the result to disk in a pickle file. Clearly I’m not going to be doing any optimization of the pickle module, though I could reconsider just how much of this data to save. The processing of the corpus takes about thirty seconds, which frankly, I can live with. 😉
You have some genuinely beneficial information composed here. Good job and keep posting good stuff.