
TL;DR: I talk about some text frequency analysis I did on the arxiv.org corpus using python, mysql, and R to identify trends and spot interesting new physics results.
In one of my previous posts, I mentioned some optimization I had done on a word-frequency anlysis tool. I thought I’d say a bit more here about the tool (buzzArxiv), which I’ve put together using Python and R to find articles that are creating a lot of ‘buzz’.
For those who don’t know, arxiv.org is an online repository of scientific papers, categorized by field (experimental particle physics, astrophysics, condensed matter, etc…). Most of the pre-print articles posted to the arxiv eventually also get submitted to journals, but it’s usually on the arxiv that the word about new work gets disseminated in the community. The thing is, there’s just gobs of new material on there every day. The experimental, pheonomonolgy, and theory particle physics mailings can each have a dozen or so articles per day.
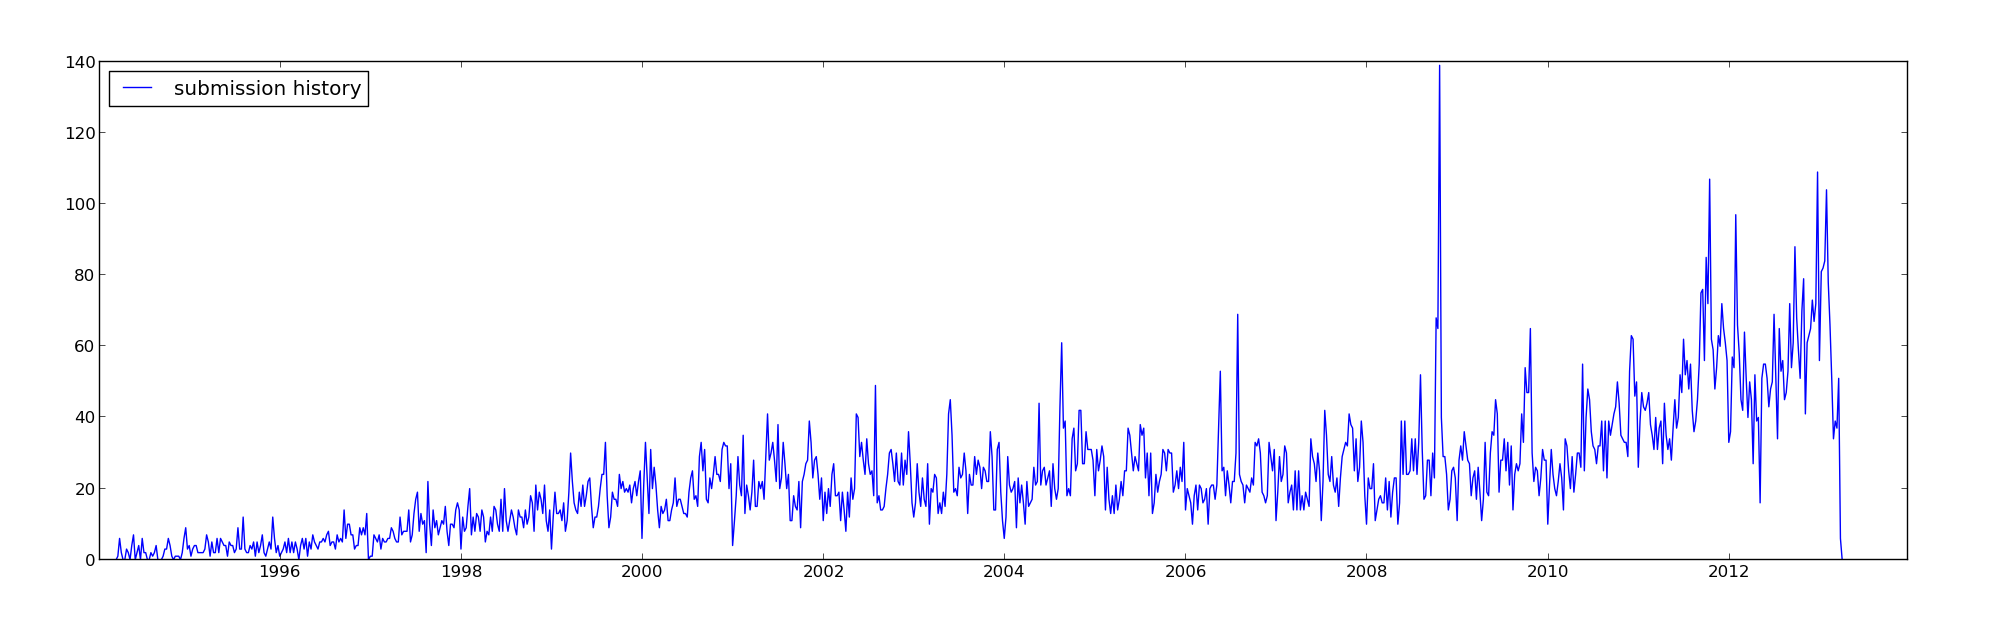
As you can see, the number of submissions has been steadily increasing over the years. I organize the experimental particle physics seminar at SLAC, and I try to stay on top of new developments in the field, but it’s very hard to cull the wheat from the chaff. Most big news ends up spreading by word of mouth, or by blog, but the coverage can be spotty.
Arxiv is very liberal with their data, providing daily mailings, RSS feeds, and even bulk data access. So, I started pulling the article metadata (author list, abstract, etc…) regularly in the hopes of partially automating the task of picking out results of interest by looking for outliers in the distribution of word frequencies.
I build the arxiv corpus using a bare-bones OAI-PMH client in python which runs weekly. The text is cleaned (I use some regexes to drop the plurals, convert meta-characters, drop capitalization, etc…). The cleaned articles are stored on my laptop in a mysql database.
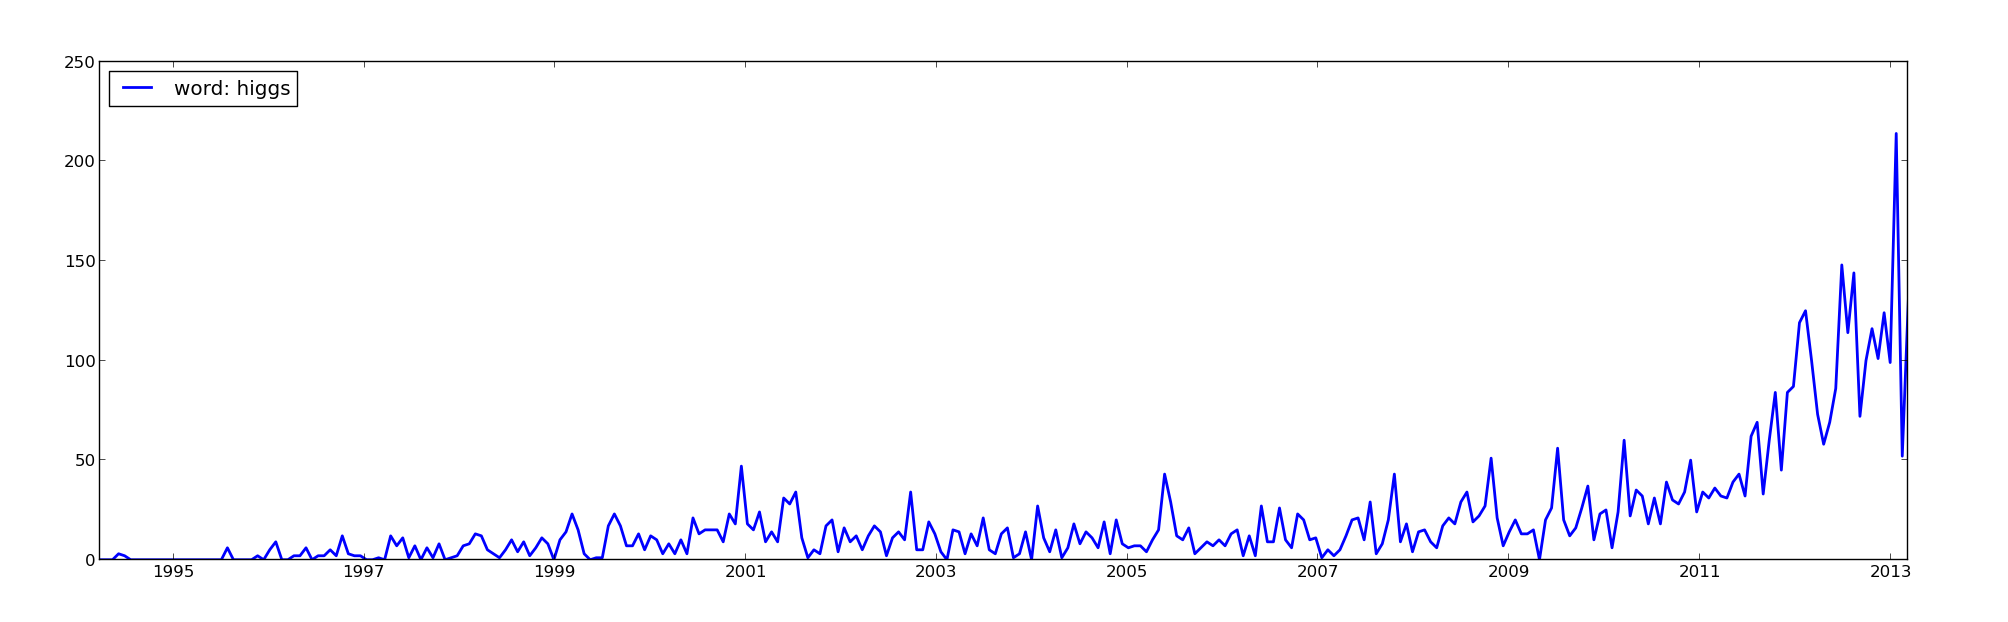
Physicists were all very excited by the Higgs announcements on July 4th of last year, producing tons of articles within weeks of the results. Then again, this event was easy to spot, the news made the cover of all sorts of magazines.
It’s at about this stage that I realized my code was getting clunky and I was putting a lot of work into coding the identification of the trends. So, I remade the part that does the text analysis in R.

Less than 30 lines of code later, I’ve got plots like the one above. The dark dashed line is a spline describing the mean behaviour of the distribution, the light dashed lines are the one standard deviation bounds, and outliers are flagged with big circles around the data points. This clearly identifies the Super-K experiment’s evidence for neutrino oscillation in 1998 and the SNO experiment’s confirmation in 2001. More recently, it also picks up on all the fuss made by the OPERA experiment’s superluminal neutrinos, as well as the retraction after the collaboration identified their faulty wire.
It’s not just the earth-shattering, bound for the history books, kind of stuff that gets identified. BuzzArxiv picked up that the MEG experiment has released their first results. Guess who’s lined up a seminar for May on lepton flavor violation! 😉
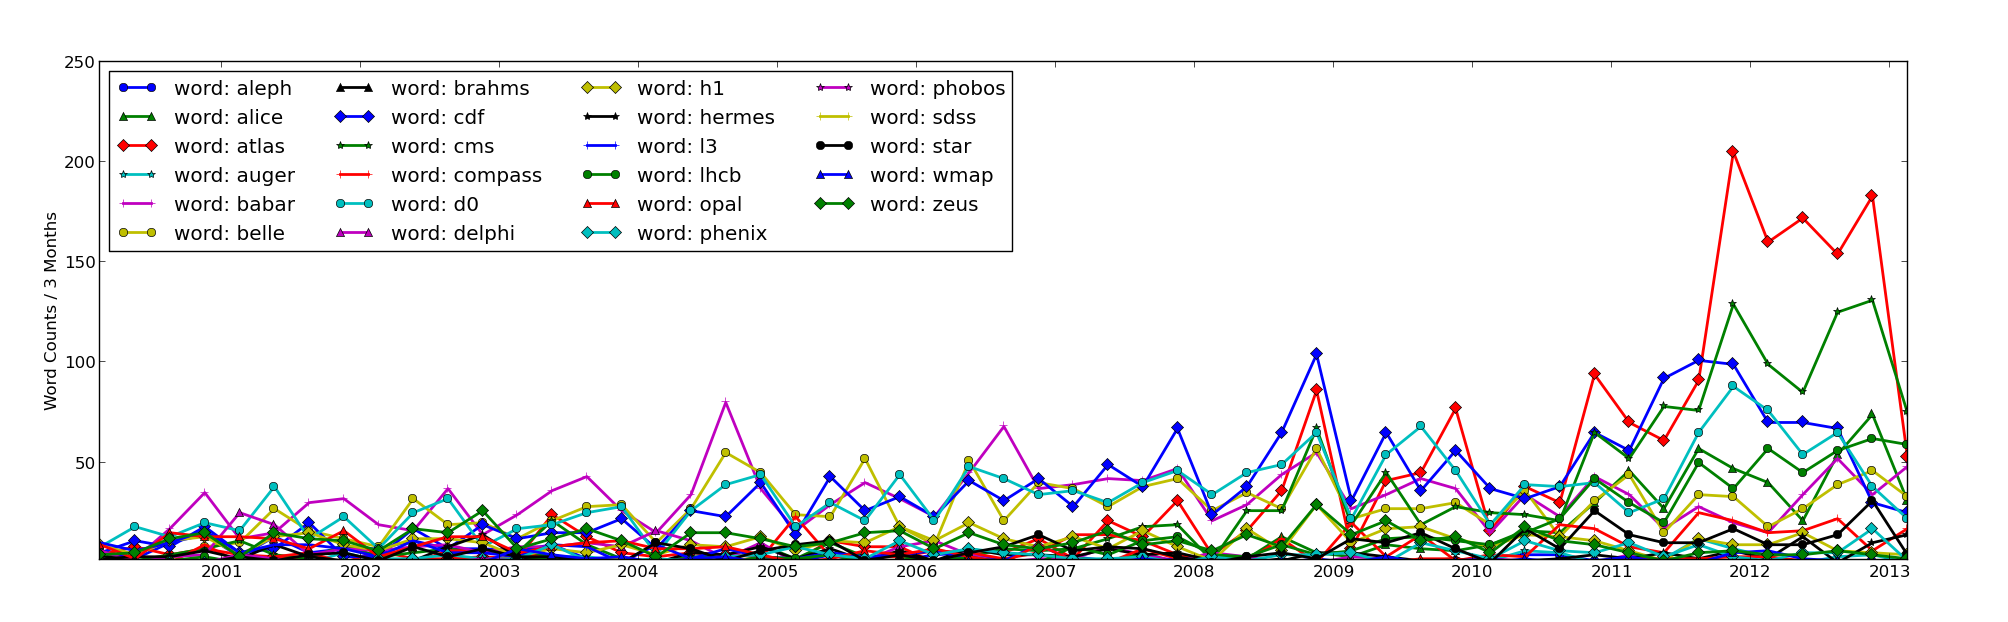
One more humerous note on the way out. The plot below shows the counts for a few of the big particle physics experiments (past and present). The LHC experiments have clearly been producing gobs of results, and ATLAS (the red line with diamond markers) seems to be handing CMS (the green line with star markers) it’s lunch.
My chest swells with pride. Then I try the same requiring that each word only counts once per article.
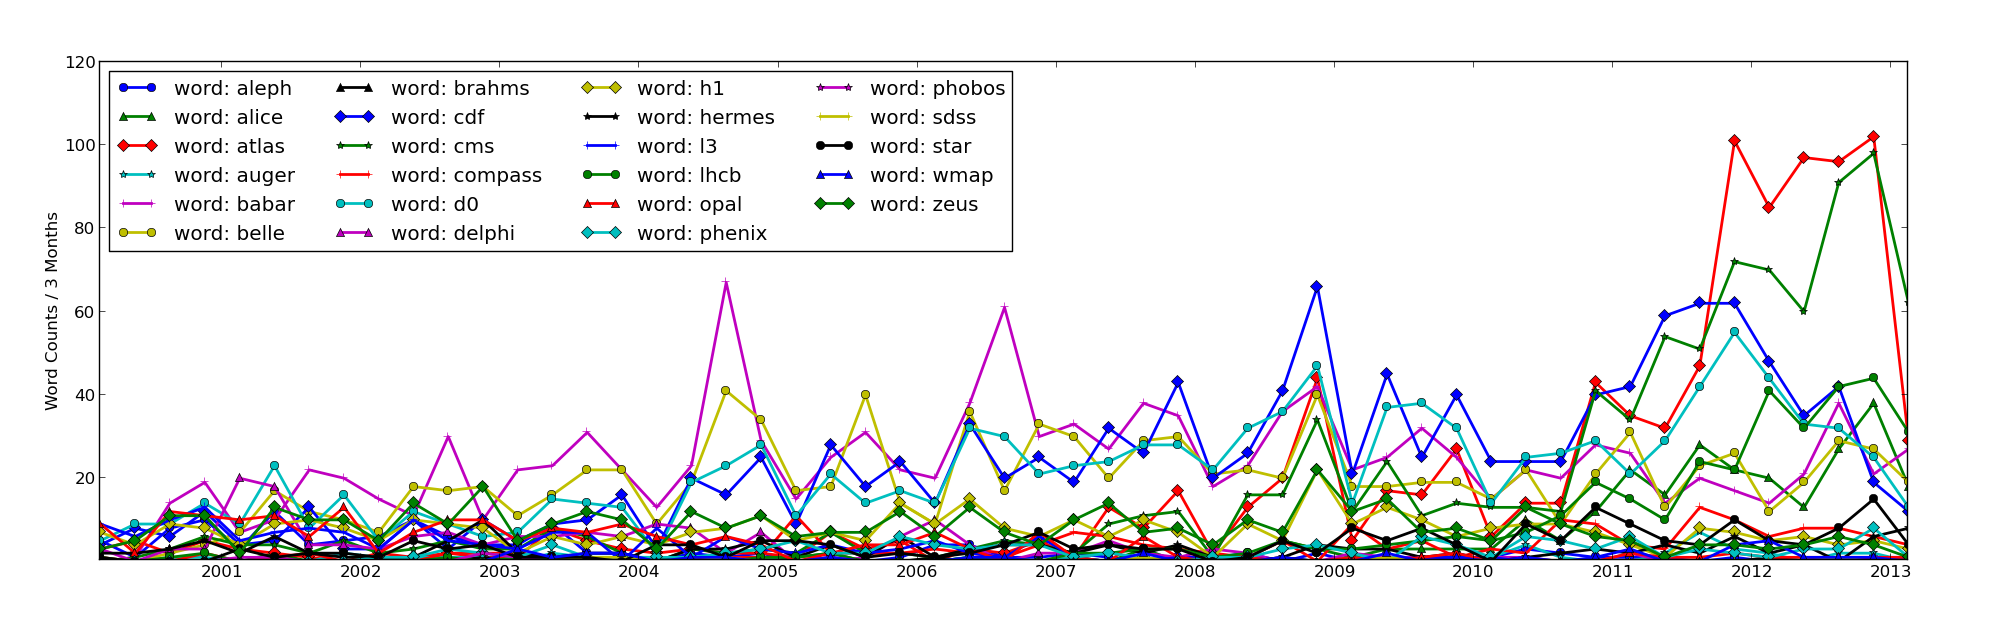
Turns out we don’t really beat them by that much, we just like to refer to ourselves a lot in our own articles. I’m going to try not to do too much psycho-analysis on that point.